
Fig. 3.
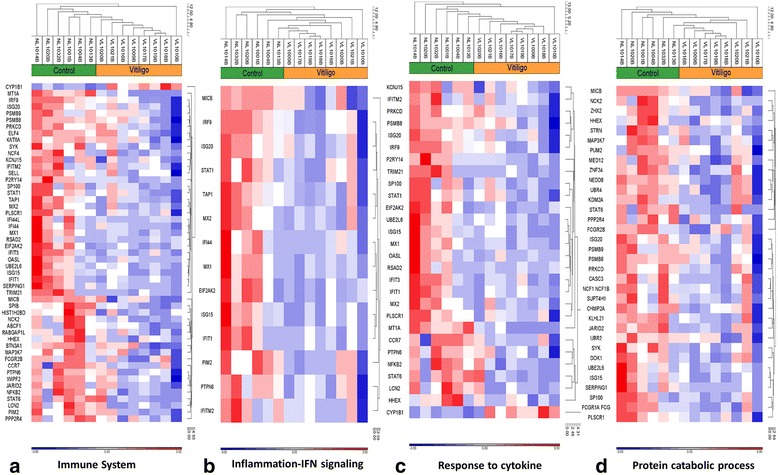
Disease-related GO pathways and processes enriched in VL-blood profile. Robust signals of: (a) immune system (51 DEGs), (b) IFN signaling and inflammation (14 DEGs), (c) response to cytokine (28 DEGs), and (d) protein catabolic process (34 DEGs), are revealed in the VL-blood DEGs. In the heat maps, red indicates upregulation while blue indicates down-regulation and white indicates unchanged expression. The blood samples cluster into VL patients (orange) and healthy controls (green). Expression value intensities are illustrated by the color of the scale with a range of -3.0 to +3.0 on a log scale