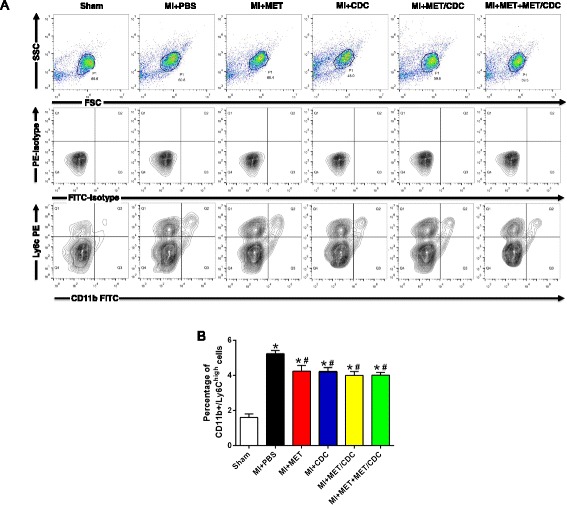
Fig. 5.

The effect of metformin (MET) treatment on the inflammatory response in post-myocardial infarction (MI) hearts. Representative contour plots (a) and quantification (b) of infiltrating monocyte population (Ly6Chigh/CD11b+) in cells isolated from infarcted hearts at 48 hours post-MI analyzed by FACS analysis. n = 5. Data were analyzed by one-way ANOVA with post-hoc comparisons by the Tukey’s test. *P < 0.05 vs. Sham; # P < 0.05 vs. MI + phosphate-buffered saline (PBS). MET/CDC MET-pretreated cardiosphere-derived cells
