Fig. 1.

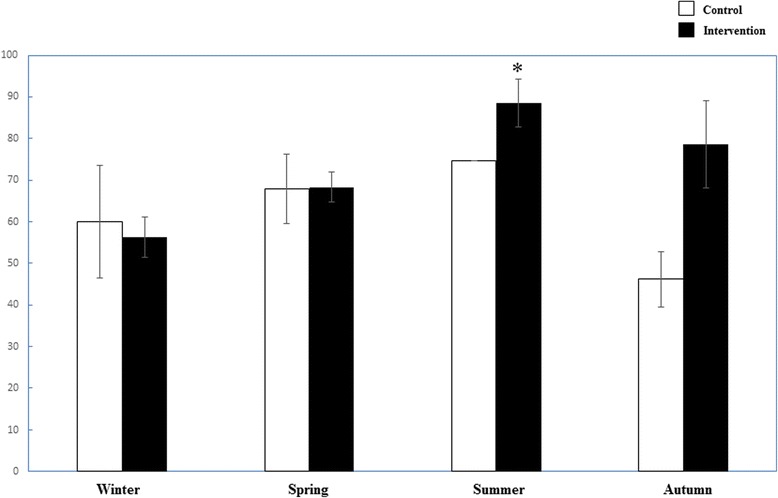
Comparison of Vitamin D deficiency rate of different seasons between the two groups. Control □ group; ■ Intervention group. *: p < 0.05 compared between the two groups

Comparison of Vitamin D deficiency rate of different seasons between the two groups. Control □ group; ■ Intervention group. *: p < 0.05 compared between the two groups