Fig. 12.

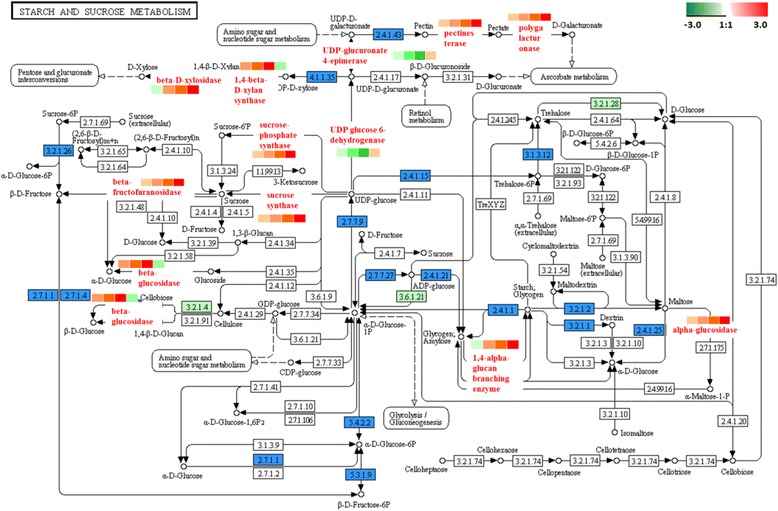
Starch and sucrose metabolism. The protein levels of the regulated enzymes are shown in coloured squares. In sequence order (left to right), stages are displayed from 5DAA,15DAA, 25DAA and 35DAA

Starch and sucrose metabolism. The protein levels of the regulated enzymes are shown in coloured squares. In sequence order (left to right), stages are displayed from 5DAA,15DAA, 25DAA and 35DAA