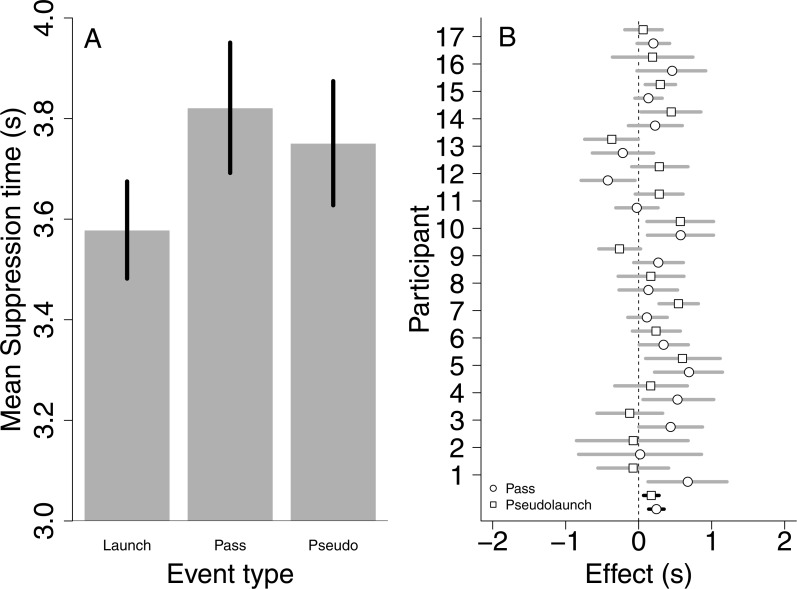
Figure 3. Results of Experiment 2.
(A) Bar plot depicting mean suppression times for all three event types. Errors bars are 95% within-subject confidence intervals. (B) Plot depicting the effect of event type for each observer separately (gray) and across all observers (black, difference between the bars in the left figure). Dots depict the mean difference between suppression times from pass and launch events, where positive values indicate that launch events entered awareness faster compared to pass events. Squares depict the same information, but now for launch vs. pseudolaunch events. Lines indicate 95% bootstrapped confidence intervals (based on 10,000 bootstrap samples). Most of the data points lie to the right of a zero difference, indicating that launch events enter awareness faster than pass or pseudolaunch events.

