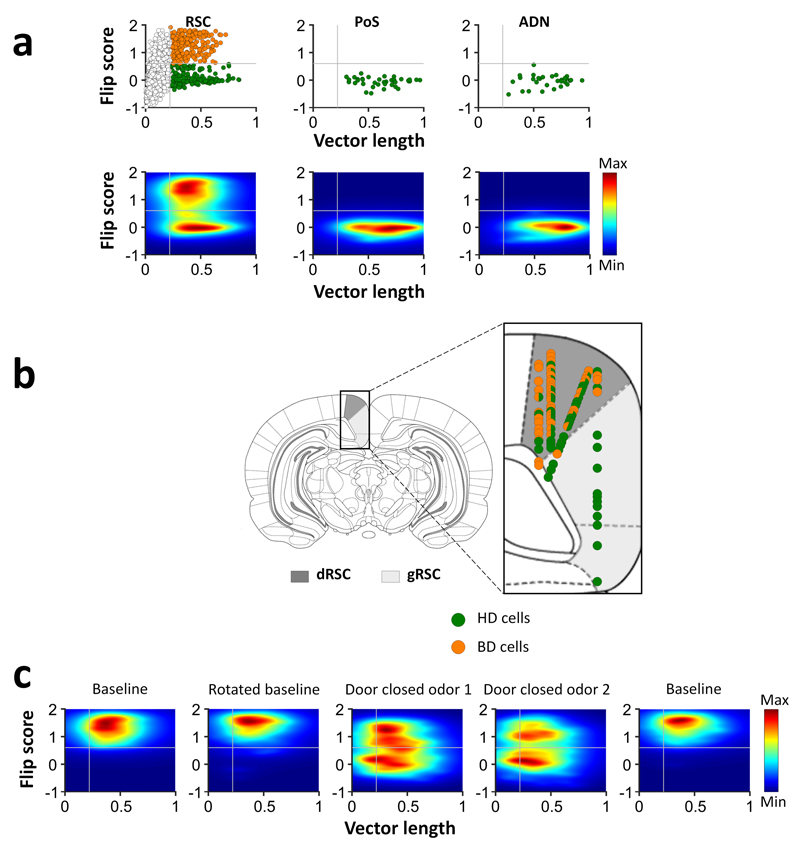
Figure 2. Bi-directional cells are specific to dysgranular RSC.
a, Distribution of bi-directional firing patterns (“flip score”) as a function of directional tuning (calculated as angle-doubled Rayleigh vector length – see Methods) for 1090 RSC cells, and postsubiculum (PoS) and anterior thalamus (ADN) cells in trial 1. Gray lines show the Rayleigh vector and flip score thresholds for determining all directional cells and BD cells, respectively. Top, scatter plot showing BD cells (orange) and HD cells (green). Bottom, density plots of the same data revealing two clear populations. b, Recording sites of BD (orange) and HD (green) cells within the dysgranular (dRSC, dark gray) and granular (gRSC, light gray) RSC. c, Density plots of RSC BD cells across 5 recording trials, collapsed across cells/sessions. Note that some cells became uni-directional (low flip score) when the door closed.

