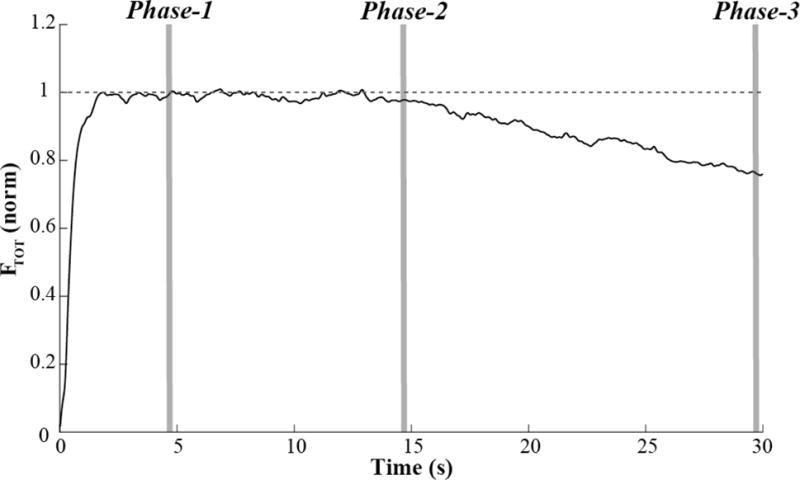
Figure 3.

A typical example of total force (FTOT) time series during the task with no feedback after Phase-2. The three phases are shown by gray vertical columns. Phase-1 corresponded to the time interval between 4.7 and 4.8 s (performance under the original task, {FTOT, MTOT}); Phase-2 corresponded to the time interval between 14.7 and 14.8 s (performance under the added constraint on the middle finger force), and Phase-3 corresponded to the time interval between 29.7 and 29.8 s (the end of the trial).
