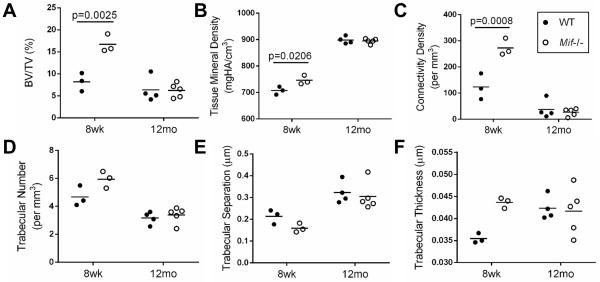
Figure 4.
μCT analysis of 8-week old and 12-month old male mice with Mif deletion and wild-type controls. Bone density parameters of the proximal metaphysis of the tibia were analyzed using Scanco software in 8-week old WT (n=3) and Mif−/− (n=3) and in 12-month old WT (n=4) and Mif−/− (n=5) mice. A. Bone volume fraction. (BV/TV=bone volume/total volume) B. Tissue mineral density. (HA=hydroxyapatite) C. Connectivity density. D. Trabecular number. E. Trabecular separation. F. Trabecular thickness. Horizontal lines on graphs represent the mean of each group. Significant differences were determined by two-way ANOVA followed by Tukey’s multiple comparisons post-hoc test.

