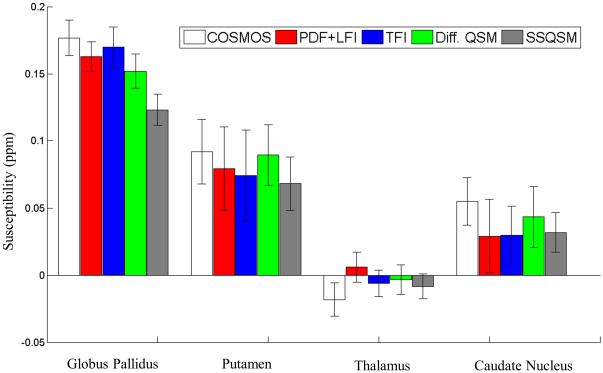
Figure 6.
Mean and standard deviation of measured susceptibilities of globus pallidus, putamen, thalamus and caudate nucleus in Figure 5 for COSMOS, PDF+LFI, TFI, Differential QSM and SSQSM. These 5 methods show comparable measurement for putamen, thalamus and caudate nucleus. For globus pallidus, SSQSM shows significant underestimation than COSMOS, PDF+LFI, TFI or Differential QSM.

