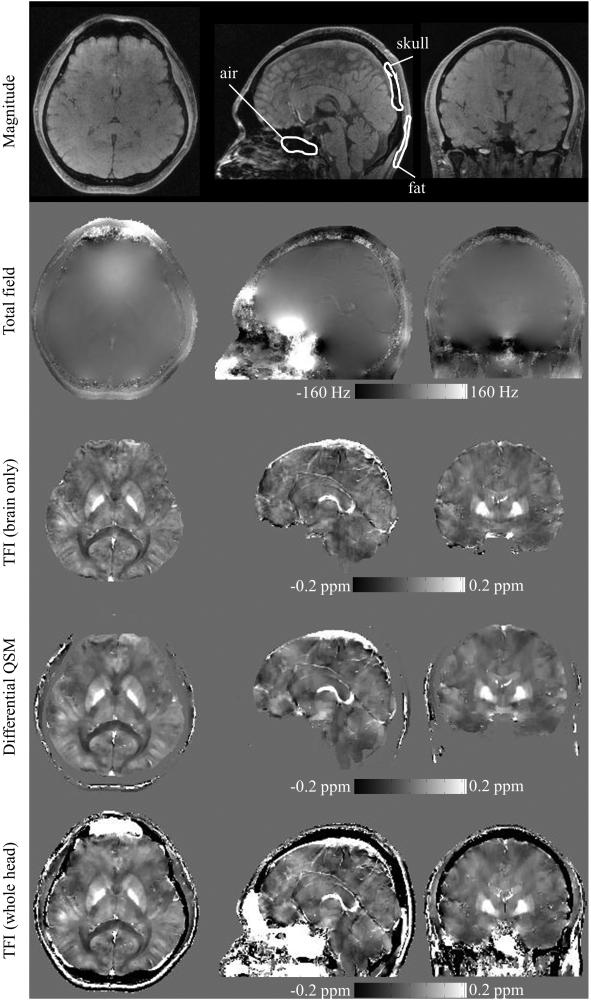
Figure 8.
Magnitude (first row), total field (second row), TFI-generated brain QSM (third row), Differential QSM (fourth row) and TFI-generated whole head QSM (bottom row) are shown in axial (left column), sagittal (middle column) and coronal (right column) views. The susceptibility distribution for skull, air filled sinuses and subcutaneous fat is clearly depicted with whole head TFI. Example ROIs are shown and mean susceptibility values are calculated for: nasal air = 7.38 ppm, skull = −1.36 ppm and fat = 0.64 ppm.

