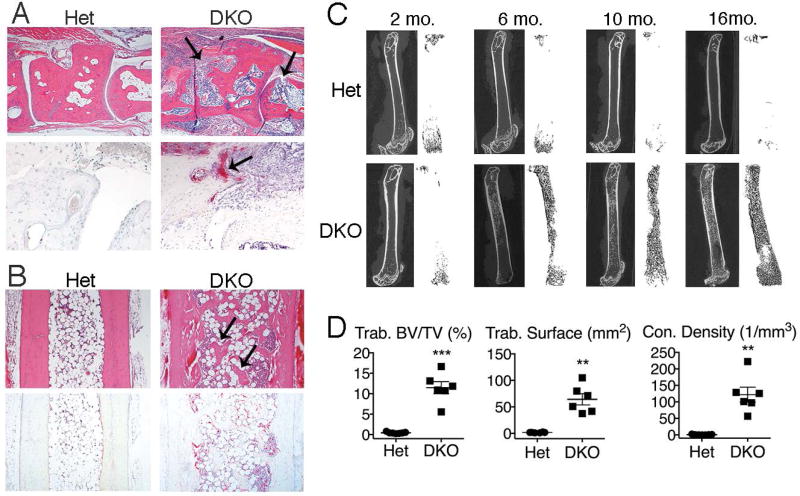
Figure 1. Trabecular bone accrual occurs over time in long bones of DKO mice.
A) Midfoot, 10 month-old mice (female, n=4 mice/genotype): Representative H&E (upper panels) and TRAP (lower panels) stained images of inflammation and articular bone erosions (arrows). Magnification 4x and 20x, respectively. B) Tibiae, 10 month-old mice (female, n=6 mice/genotype). Representative images of H&E and TRAP stained sections. Arrows indicate trabecular bone. Magnification 4x. C) Micro-CT images of femurs at 2, 6, 10, and 16 months (female, n=3–7 mice/genotype/age). Left images: cortical and trabecular bone. Right images: 3D reconstruction of trabecular bone. D) Quantitation of micro-CT data from 10 month-old mice (female, n=6–7 mice/genotype) for trabecular bone volume per total volume (BV/TV), trabecular bone surface, and trabecular connectivity (con.) density. Data represent 3 individual experiments. Values are the mean ± SEM compared to Het: **=p<0.01, ***=p<0.001.

