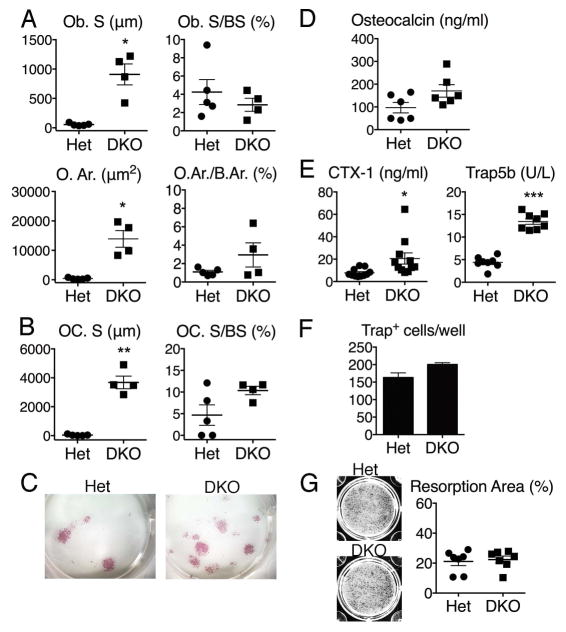
Figure 2. Osteoblast and osteoclast parameters in DKO mice.
A and B) Static histomorphometry, femurs, 10 months (female, n=4–5 mice/genotype). Abbreviations: osteoblast surface (Ob. S), bone surface (BS), osteoid area (O. Ar.), bone area (B.Ar.), and osteoclast surface (OC. S). C) Representative images from osteoblast colony forming unit (CFU) assays, 2.5 month-old mice (male, n=5 mice/genotype). Colonies are stained for alkaline phosphatase (pink). D and E) Serum bone turnover markers: Osteocalcin, C-terminal peptides of type I collagen (CTX-1), and Trap5b. 10 month-old mice (female, n=6–12 mice/genotype). F) Number of Trap+ cells in osteoclast differentiation cultures. 2.5 month-old mice (male, n=3 mice/genotype). G) Percentage of hydroxyapatite area resorbed by osteoclasts. 2.5 month-old mice (female and male, n=6–7 mice/genotype). Values are the mean ± SEM compared to Het; *=p<0.05, **=p<0.01, ***=p<0.001.

