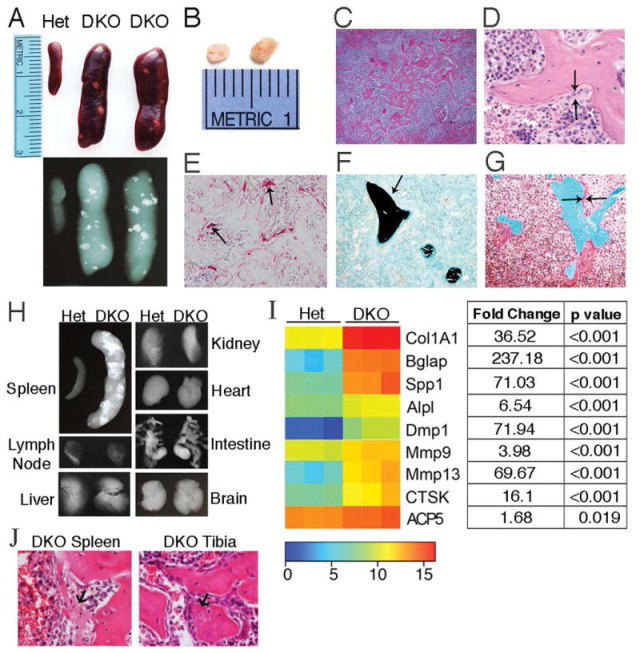
Figure 3. Ectopic bone forms in DKO spleens.

A) Representative images and X-rays of spleens from 10 month-old mice (female, n=6 mice/genotype). B) Islands of bone removed from 10 month-old female DKO spleens. C–G) Representative images of histologic stains performed on DKO spleen sections. 10 month-old mice (female, n=3 mice). C and D) H&E stained sections showing bone formation in white pulp (Magnification 4x & 20x, respectively). Arrows identify osteoblasts lining the surface of bone. E) TRAP stain, osteoclasts (arrows). F) Von Kossa/Fast Green stain shows mineralized bone (black, arrow). G) Goldner’s trichrome stain demonstrates osteoid production (dark pink, arrows). H) Representative X-rays of organs, 22 month-old mice (female, n=3 mice/genotype). I) Heatmap: Nanostring mRNA profiling of key bone remodeling genes, 10 month-old spleens (female, n=3 mice/genotype). Mean intensities of gene expression were transformed by a log2 function. Table lists fold change in DKO vs. Het gene expression and the corresponding p values. J) Representative H&E images of bone formation in DKO spleen and tibia. Arrows indicate fibrous tissue representing early bone matrix that may become mineralized.
