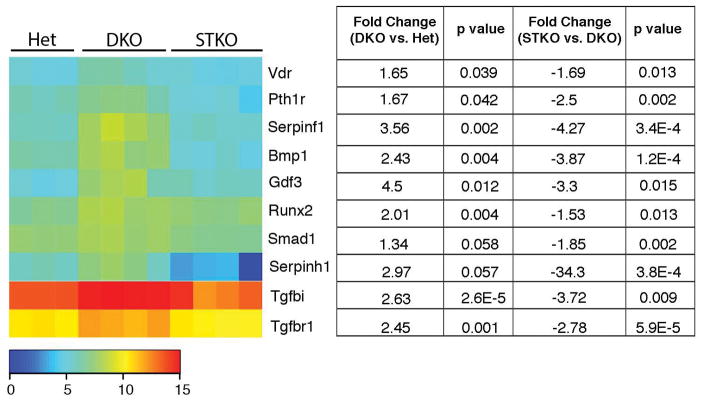
Figure 5. STING-dependent induction of factors regulating osteoblast differentiation in DKO mice.
Heatmap: Mean intensities of expression in gene arrays, spleen, 10 month-old mice (n=3–4 mice/genotype). Signals were transformed by a log2 function. Table lists fold change in DKO vs. Het and STKO vs. DKO gene expression and the corresponding p values.

