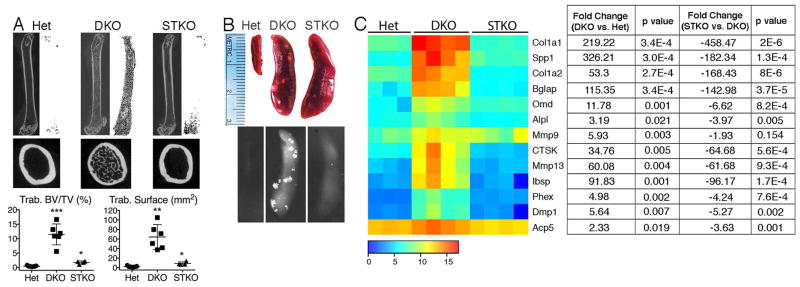
Figure 6. Bone accrual in DKO mice requires the STING pathway.
A) Sagittal and transverse micro-CT images of femurs and quantitation of micro-CT data for trabecular bone volume/total volume (BV/TV) and trabecular bone surface. The Het and DKO values are the same as those shown in Figure 1D. 10 month-old mice (female, n=4–7 mice/genotype). Values are the mean ± SEM compared to Het; *=p<0.05, **=p<0.01, ***=p<0.001. B) Representative images and X-rays of spleens. All analyses performed on 10 month-old mice (female, n=4–6 mice/genotype). C) Heatmap: Mean intensities of expression in gene arrays, spleen, 10 month-old mice (n=3–4 mice/genotype). Signals were transformed by a log2 function. Table lists fold change in DKO vs. Het and STKO vs. DKO gene expression and the corresponding p values.

