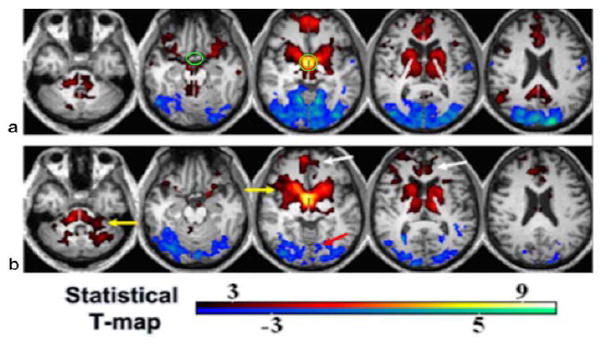
FIGURE 5.

Hypothalamic resting-state network (RSN) in controls (a) and MTBI patients (b) using seed-based one-sample t-test and corrected P < 0.05. Green circle in (a) marks the hypothalamic ROI. Red-yellow color indicates positive correlation, while blue-cyan indicates negative correlation. There was significantly decreased connectivity in MTBI in both positive (white arrows) and negative (red arrow) networks and increased RSN (yellow arrows) using a two-sample t-test (P < 0.05).
