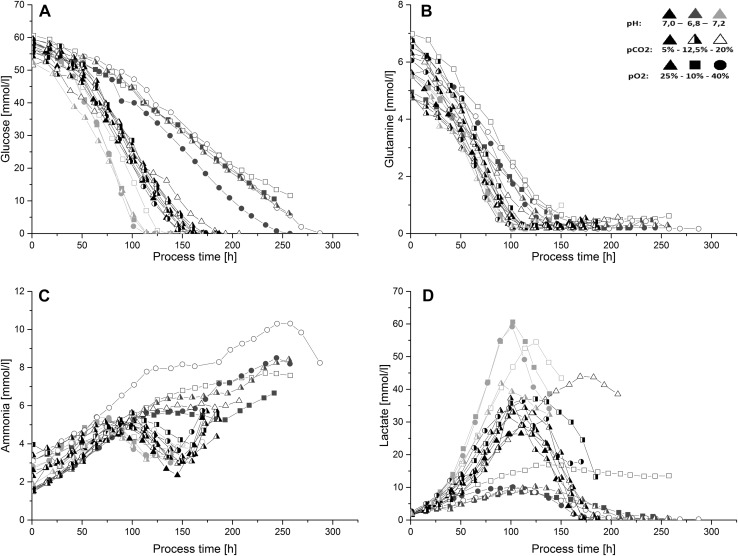
Fig. 2.
Metabolite profiles for all conducted batch processes. (Black symbols represent processes at pH 7.0, blue symbols at pH 6.8, red symbols at pH 7.2; closed symbols represent processes at pCO2 5 %, half-closed at 12.5 % and open symbols at 20 %; triangles represent processes at pO2 25 %, squares at 10 %, circles at 40 %). a Glucose became limiting in almost all fermentations before reaching the harvest criteria of 75 % viability. b Glutamine profiles showed glutamine limitations after 100–150 h of process time for all batches. c Ammonia concentrations showed process phases of production and consumption for almost all runs at pH values of 6.8 and 7.0, whereas only production and steady-state values were derived from fermentation runs at pH 6.8. d Lactate was produced and consumed during all processes

