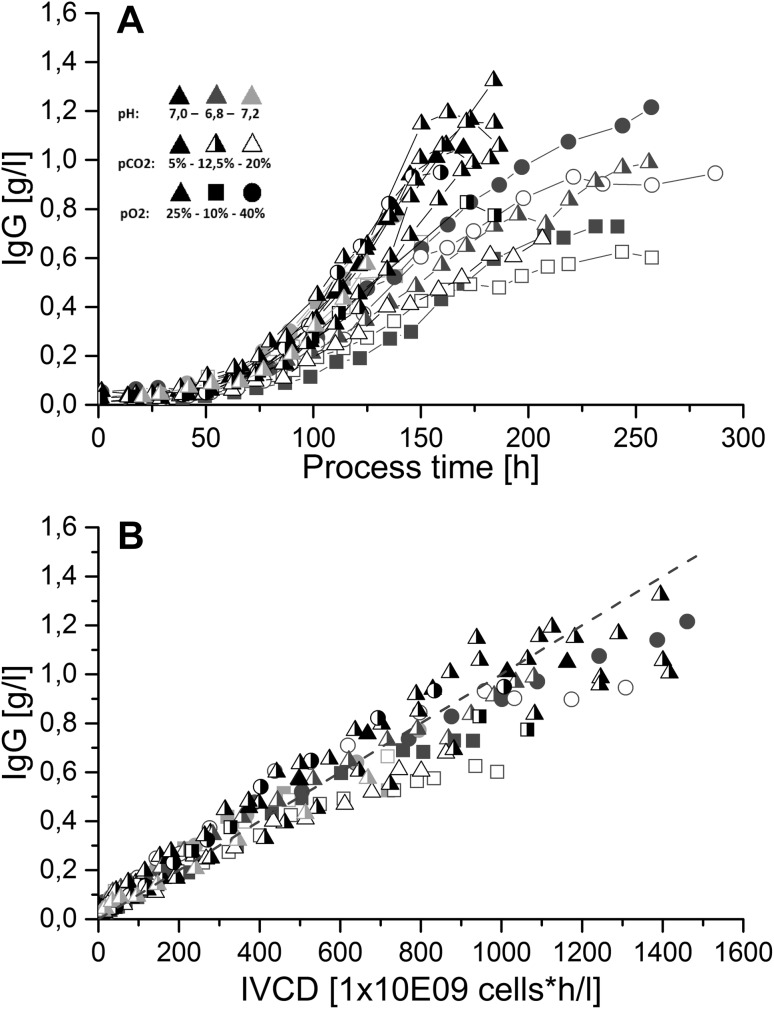
Fig. 3.
IgG concentration over process time (a) and integral viable cell density (b) for all batch fermentations. (Black symbols represent processes at pH 7.0, blue symbols at pH 6.8, red symbols at pH 7.2; closed symbols represent processes at pCO2 5 %, half-closed at 12.5 % and open symbols at 20 %; triangles represent processes at pO2 25 %, squares at 10 %, circles at 40 %). Highest process titers were obtained for fermentation runs conducted at pH 7.0 and 6.8, mainly due to the highest IVCD values at these process conditions

