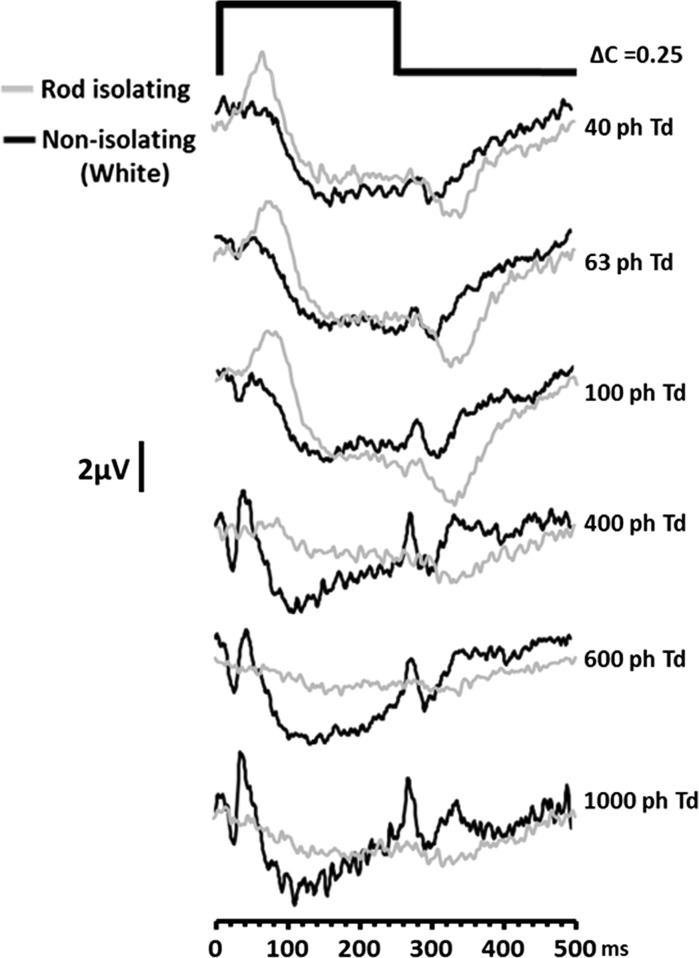
Fig. 4.
ERGs elicited by a non-isolating (white) stimulus of increasing intensity (black traces). Also shown are the responses for the rod-isolating stimuli at the same levels of retinal illuminance (grey traces). The traces represent group averaged (n = 5) responses and for all stimuli the modulation of each photoreceptor class = 0.25

