
Fig. 3.
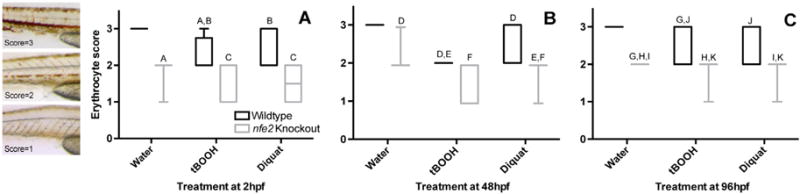
Staining and scoring of erythrocytes in developing zebrafish. Animals treated at either 2hpf (Panel A), 48hpf (Panel B), or 96hpf (Panel C) were stained with o-dianisidine, imaged and morphologically scored 48 hpe where morphological scores ranged from 1 (severe hypochromia), to 2 (mild hypochromia), to 3 (normal). Boxes represent upper and lower quartiles of scores for the group, with median score marked by the internal line. Whiskers represent the range of scores outside of the middle 50% (excluding outliers). Shared letters indicate no statistical difference within a time point (two-way ANOVA, Tukey’s multiple comparisons test, p ≤ 0.05). No outliers were present.