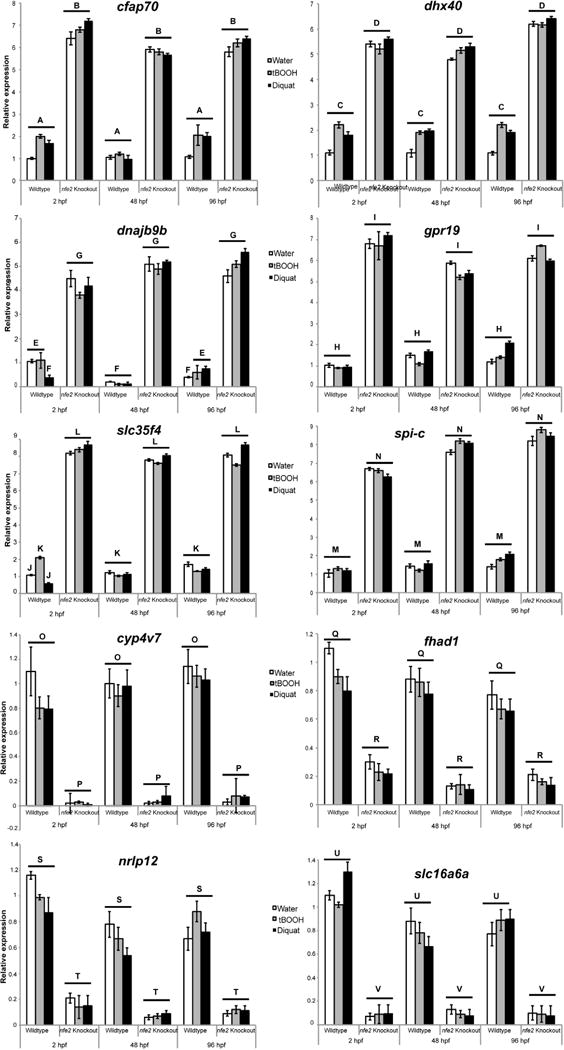
Fig. 6.

Relative expression of commonly up- and down-regulated genes across treatment and time in nfe2 knockout as measured by qRT-PCR. Relative expression values are shown for each gene, where b2 m was used as a housekeeping gene and values normalized to 2hpf WT water control. Data are presented as the mean ± S.E.M. (error bars), and N = 3 pools of 30 embryos. Within each gene, differences in expression were assessed using a two-way ANOVA and shared letters indicate no statistical difference.
