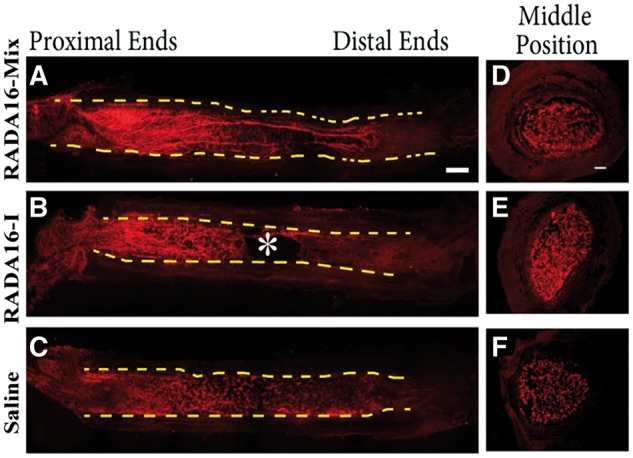
Figure 2.

The longitudinal (A–C) and transverse (D–F) full views of axon regeneration 4 weeks after implanting different grafts (A, D) RADA16-mix, (B, E) RADA16-I group, (C, F) saline. The axons were labeled with rabbit anti-NF200 in red. The dash lines indicate the inside wall of the electrospun conduits. The * indicates of the large cavity formed inside the RADA16-I graft (B). Scale bar: 1000 μm.
