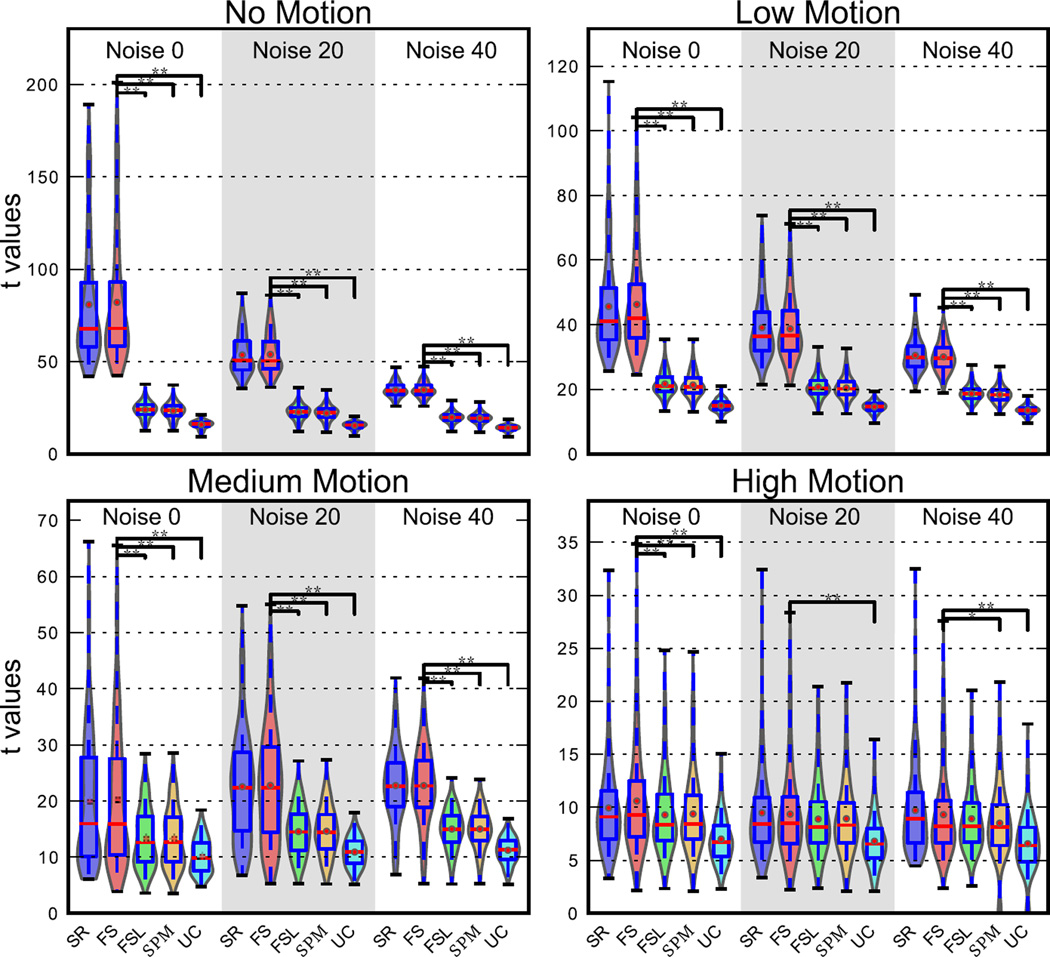
Figure 5. voxel-wise t statistic comparison from STC data and uncorrected data in the LSF ROI in simulated data for various noise and motion levels with interleave 6.
STC was carried out with three methods: FSL, SPM, and FS. The analysis was carried out for high, medium, and low motion cases, as well as three different SNR conditions (Noise 20 indicates that 20% of the signal’s energy is from white noise, and so on). Each violin plot contains values from 20 scans. Higher values indicate that a STC method had higher z scores than data that was analyzed with no STC. Two stars indicate that these z differences are also significantly different from our method (FS), t<0.001, one star indicates significance p<0.05.

