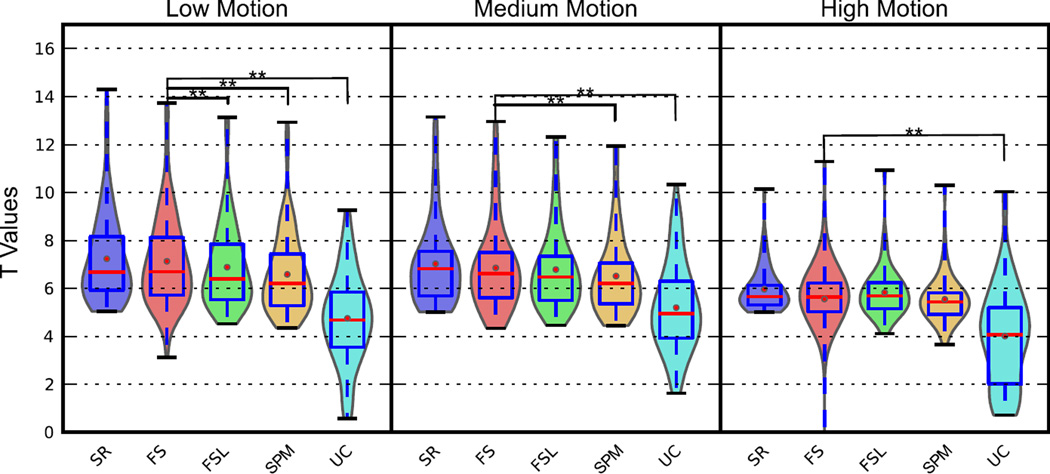
Figure 6. Voxel-wise t statistic from STC data and uncorrected data in the visual ROI in real data for various motion levels with interleave 6.
The top 20 voxels from the Shifted-Regressor method were identified from the slice with high delay (Slice 17) that intersected the region of significant activation. The values from these voxels were then extracted from all other STC methods for comparison. (30 subjects’ real data with three levels of motion.) Methods that are significantly different than the proposed method (p < 0.001) are indicated with a star, pair-wise t-test.

