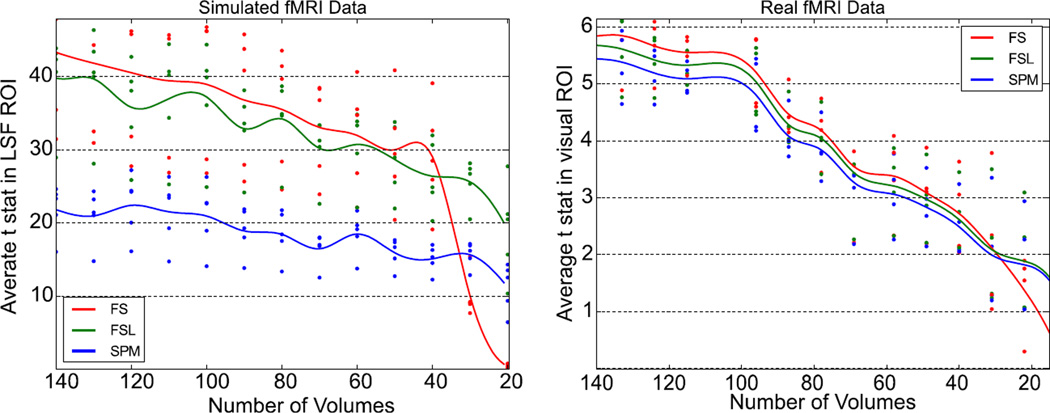
Figure 7. Performance of STC methods compared to the length of the initial fMRI time series on simulated and real data.
(Left) Simulated data: top 20 t statistics vs length of scan by method for five subjects, extracted from the slice with maximum delay (slice 17) in the region with significant activation. Divergence between our STC method and controls occurs at ~ 38 volumes. (Right) Real data: top 20 t stats vs length of scan by method for five subjects. Divergence occurs at ~ 27 volumes

