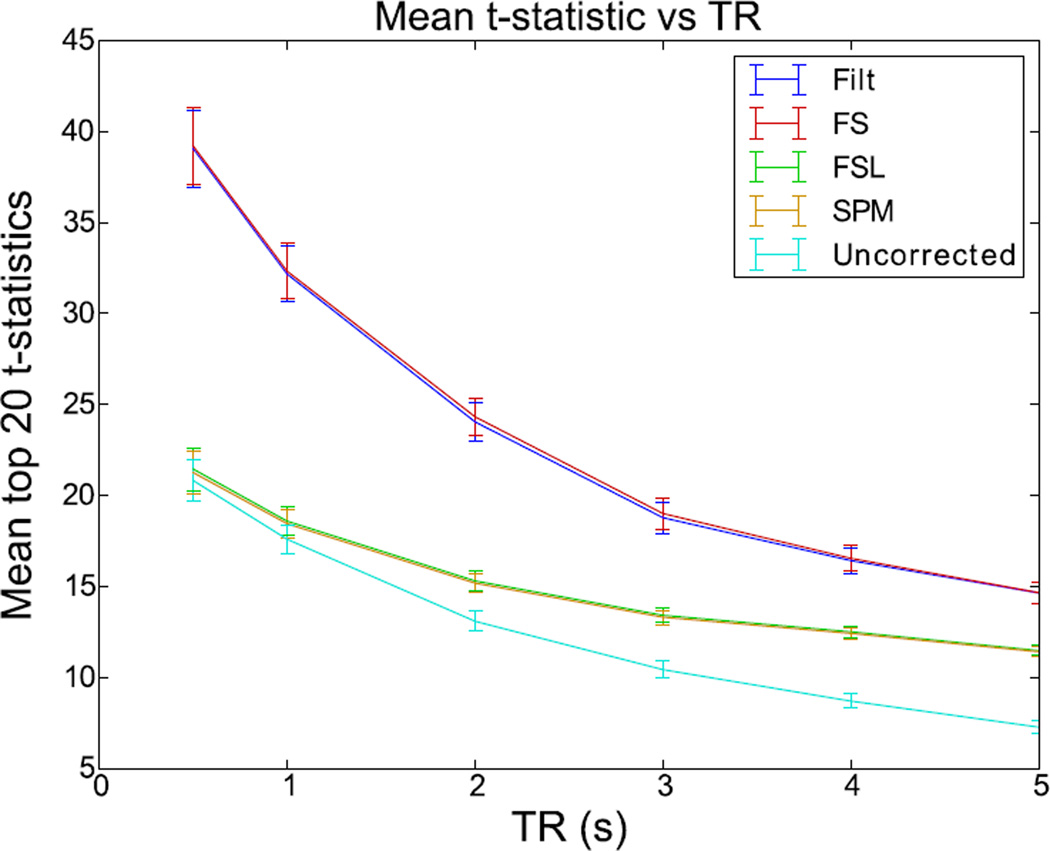
Figure 8. Effect of increasing TR on the STC gain on simulated data.
T values from LSF region in simulated data with TRs varying from 0.5 to 5 seconds extracted from a slice with maximal delay (slice 18). Error bars represent the 95% confidence interval, calculated from the extracted t values for each method across all 13 subjects.

