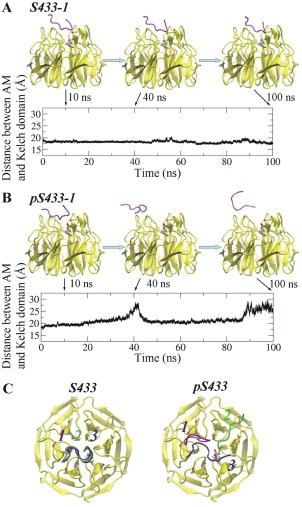
Figure 6.

Distance between the acidic motif and the Kelch domain as a function of time. Time‐dependent change in the distance between the acidic motif and the Kelch domain with unphosphorylated S433 (A: S433‐1) or phosphorylated S433 (B: pS433‐1). Shown are results from one of the three simulations in each system. Snapshots of the acidic motif at 10, 40, and 100 ns of are shown. (C) Representative structures of the AM relative to the Kelch domain containing unphosphorylated or phosphorylated S433. The AM in the three independent simulations are shown in purple, green, and blue, respectively.
