
Figure 7.
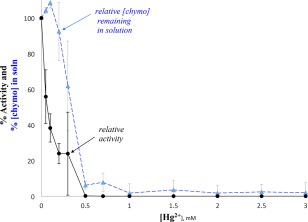
Hg2+ decreased how much chymotrypsin remained in solution, and chymotrypsin's activity. Each point is the average of three measurements, and y axis error bars = standard deviation; the activity of each set was normalized to the 0 mM concentration for that day. [chymotrypsin] calculated from A281 and ε281. Prior to Hg2+ additions, solutions contained 50 mM MOPS buffer, pH 7.14 and initial [chymo] = 20 µM. Final [succinyl phenylalanine] = 3 mM.