
Figure 8.
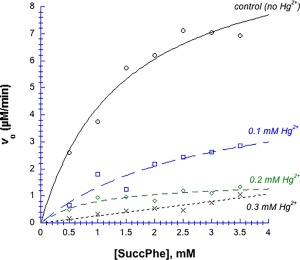
Michaelis–Menten plot of chymotrypsin in the presence of Hg2+, in 50 mM MOPS, pH 7.14. Substrate was the amide succ‐phe, data were fit to Eq. (2). Black circles = control (without Hg2+), blue squares = 0.1 mM Hg2+, green diamonds = 0.2 mM Hg2+, black Xs = 0.3 mM Hg2+. Final [chymotrypsin] remaining in solution, and all fitted Michaelis–Menten parameters are listed in Table II. For the 0.3 mM Hg2+ curve, V max and K m returned P values ≫ 1, indicating that these points do not fit hyperbolic saturation.