
Figure 9.
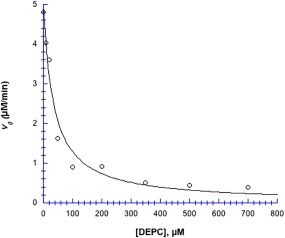
DEPC inhibitor profile. 40 µM chymotrypsin in 50 mM MOPS at pH 7.14, incubated with DEPC for 10 min, after which, the substrate pNPA was added to a final concentration of 2.9 mM. Data were fit to Eq. (3): v o (control) = 4.98 ± 0.27 µM min−1; IC 50 = 35 ± 6 µM; R 2 = 0.97. Uncertainties in v 0 values (obtained from ΔA 410/Δt slopes) are smaller than the point symbols.