
Figure 3.
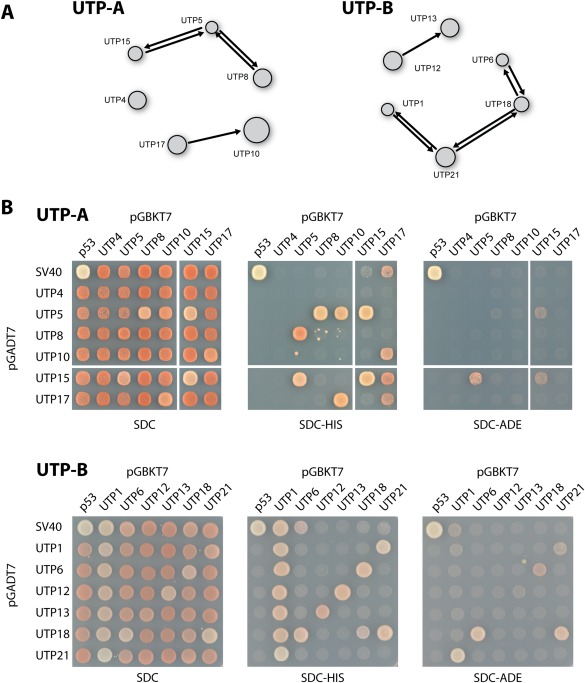
Y2H interaction within the ctUTP‐A and ctUTP‐B complex. (A) The interaction network as derived from the large‐scale screen is depicted. An arrow from the prey protein (AD) towards the bait protein (BD) shows a positive interaction between the connected proteins. The displayed network is derived from the interactive software tool that contains the complete dataset that can be accessed at http://y2h.embl.de. (B) The Y2H interactions from the screen were confirmed by co‐transformation into yeast strain PJ69‐4 (see “Materials and Methods”). The transformants were analyzed for growth on SDC‐Trp‐Leu‐His (SDC‐HIS, weak interactions) and SDC‐Trp‐Leu‐Ade (SDC‐ADE, strong interactions) at 30°C. The growth phenotype after 2 days is shown. The upper panels show the results of the ctUTP‐A complex; the lower panels show the data for ctUTP‐B.