
Figure 6.
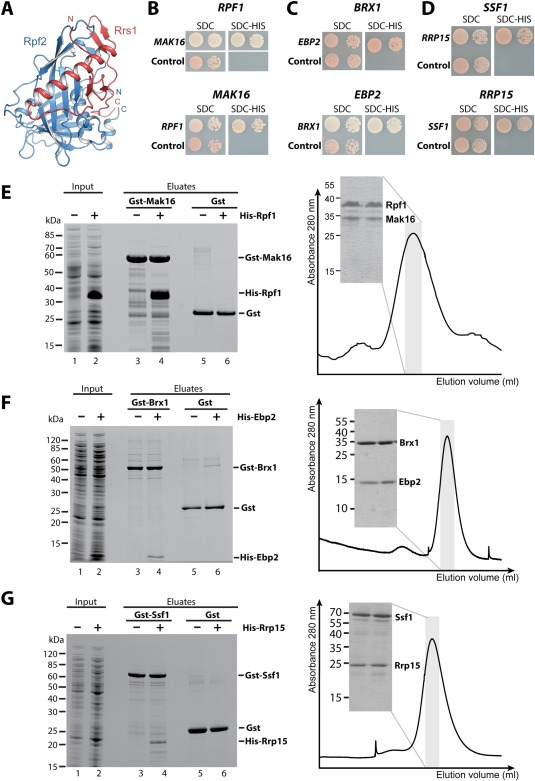
Reconstitution of the Brix–BAP complexes involved in 60S biogenesis. (A) The structure of the Brix domain Rpf2 (blue) in complex with the BAP Rrs1 (red) is shown. The structure is taken from PDB entry 5BY8.69 (B–D) A Y2H analysis of the C. thermophilum Brix proteins with their BAP is shown. The upper panel shows the ctBrix domain fused to the activation domain (pGADT7) without terminal extensions [rpf1 (156–436 aa), brx1 (30–260 aa), and ssf1 (22–359 aa)] tested with the corresponding BAP fused to DNA binding domain (pGBKT7), whereas the lower panel shows the fragment of the ctBAP (pGADT7) (mak16 (134–336 aa), ebp2 (178–268 aa), and rrp15 (194–354 aa) tested with the full‐length Brix protein (pGBKT7). SDC‐Trp‐Leu‐His plates are shown after 3 days incubation at 30°C. (E–G) A binding assay (left panel) and size exclusion chromatography (SEC, right panel) was performed to verify the Y2H interactions. For the binding assay, the indicated GST proteins were immobilized on GSH beads, washed (lanes 3, 5), incubated with E. coli supernatant containing the His6 tagged partner (lane 2), washed and eluted by GSH (lane 4). As a negative control the His6 tagged proteins were incubated with GST alone (lane 6). Right panel shows SEC analysis of the affinity‐purified complexes. SDS‐PAGE shows protein composition of the peak fraction (domain boundaries are identical as in B–D except for SEC analysis of ctBrx1 (34–259 aa)—ctEbp2 (175–282 aa), and ctSsf1 (34–478 aa)—ctRrp15 (173–354 aa) complexes.