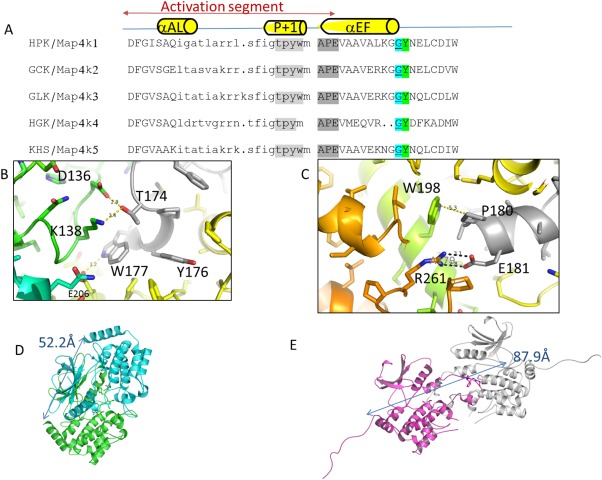
Figure 4.

Comparison of sequence and structure of GCK‐1 family kinases.dimer viaactivation loop. (A) Comparison of the activation loop sequence of GCK‐I family kinases. Alignment based on conserved DFG and APE sequences shows that all subfamily members contain a glycine or proline (cyan) just before a conserved tyrosine (green) suggesting a cross‐swapped activation loop conformation as described previously by Taylor et al.17 Sequence is colored to highlight the P + 1 sequence (light gray) and the APE sequence (dark gray). (B) Closeup of the P + 1 region forming crossdimer interactions. (C) Closeup of the APE region of the activation loop forming crossdimer interactions. (D) Hydrodynamic radius of the Map4k4 dimer; blue and green (PDB 4OBP) as measured by distance from C‐terminal helix K of both monomers (52 Å) to (E) the Map4k3 S170A crystallographic dimer (magenta and white) distance from C‐terminal helix K of the two monomers (88 Å).
