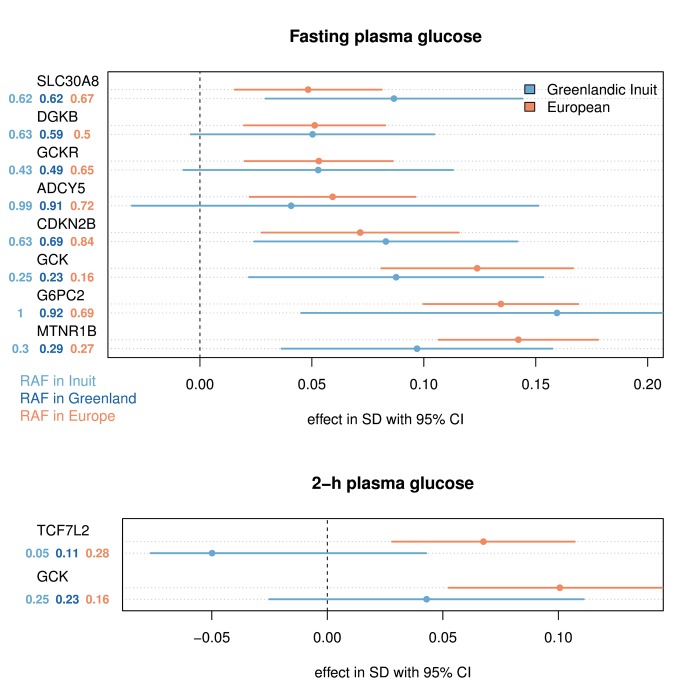
Figure 3. The effect of variants reported to associate with glycemic traits in Europeans and Greenlandic Inuit.
The effects were estimated for the ancestral population using AsaMap [47]. Only variants associated with the trait in an additive model (p < 0.01, for joint analysis of Greenlandic IHIT and B99 (n = 3693 and n = 3437) and Danish Inter99 (n = 6116 and n = 5774)) for fasting and 2-h plasma glucose respectively were included in the plot. No assumptions of similar effects of the rare allele in the two populations were made in this test, and therefore opposite effects in the two populations can still provide a statistical significant association. The effect sizes are given in standard deviation (SD) for the reported risk allele, following a rank-based inverse normal transformation. The risk allele frequency (RAF) is shown for Europeans, Greenlandic Inuit, and the admixed Greenlandic population. The variants included in the plot are: SLC30A8 rs11558471 (A/G), DGKB rs2191349 (T/G), GCKR rs780094 (C/T), ADCY5 rs11708067 (A/G), CDKN2B rs10811661 (T/C), GCK rs4607517 (G/A), G6PC2 rs560887 (G/A), MTNR1B rs10830963 (C/G) and TCF7L2 rs7903146 (C/T). In parentheses are the major/minor alleles mapped on the plus strand with the risk allele in bold face.

