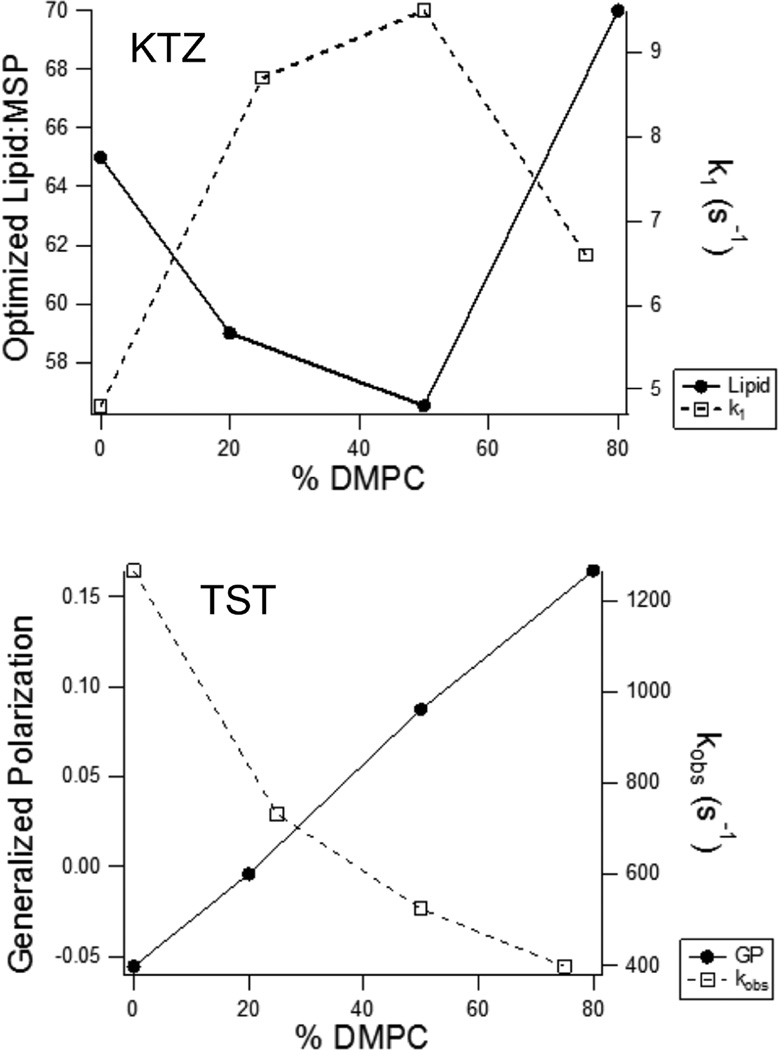
Figure 6.
Correlations of ligand binding kinetics with membrane properties of CYP3A4 nanodiscs. (Top) Optimized total lipid:MSP ratio for mixed lipid nanodiscs (● and solid line) and the rate constants for the fast phase of KTZ binding obtained by stopped-flow spectroscopy (○ and dashed line) plotted as a function of the mole percentage of DMPC in the nanodisc membrane. (Bottom) Laurdan generalized polarization (● and solid line) for mixed lipid nanodiscs and the observed rate constants for TST binding from stopped-flow spectroscopy (○ and dashed line), plotted as a function of the mole percentage of DMPC in the nanodisc membrane.

