
Figure 2.
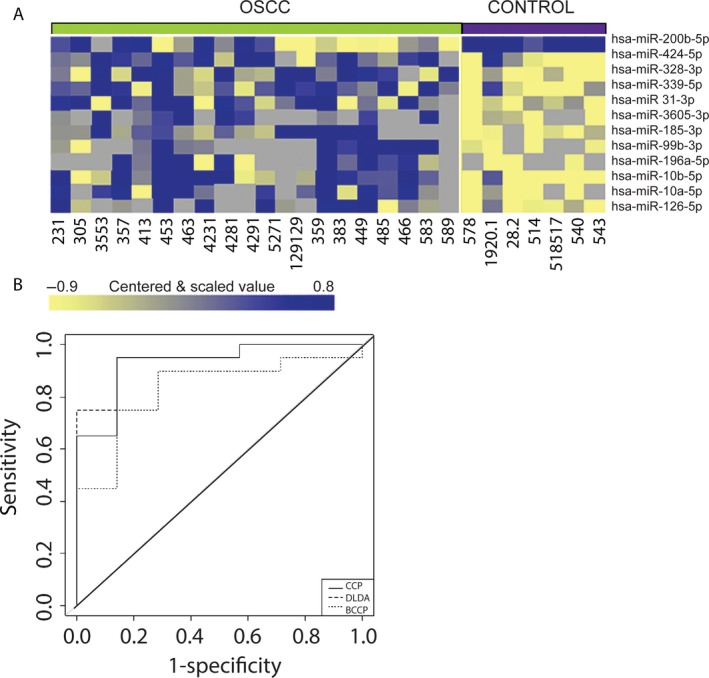
miRNAseq‐based miRNA profiles of brush biopsy samples and OSCC prediction. (A) Clustered heatmap of significantly differentially expressed miRNAs; samples grouped by class, tumor versus normal epithelium. (B) Receiver operating characteristic curve shows performance of the classifier generated using three different algorithms Compound Covariate Predictor, (CCP) Linear Diagonal Discriminant Analysis (LDDA), and Bayesian Compound Covariate Predictor and tested using leave‐one‐out cross‐validation.