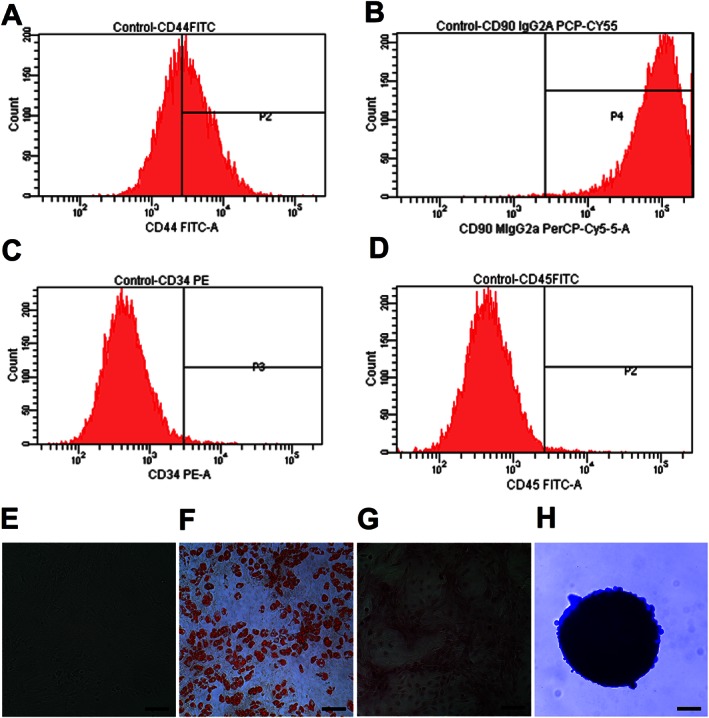
Figure 1.

Characterization of ASCs; 0.5 × 10⁶ of cultured ASCs at passage 2 were labelled with antibodies of specific cell surface phenotype markers for 30 min at 4°C and subjected immediately to flow analysis. Data represent the flow analysis of (A) CD44, (B) CD90, (C) CD34 and (D) CD45. (E) ASCs resembled fibroblast in morphology. Cells were imaged, under bright field microscopy. (F) Adipocyte staining by Oil Red ‘O′. (G) Osteocyte staining by Alizarin Red. (H) Chondrocyte staining by Alcian Blue. Scale bar = 100 μm.
