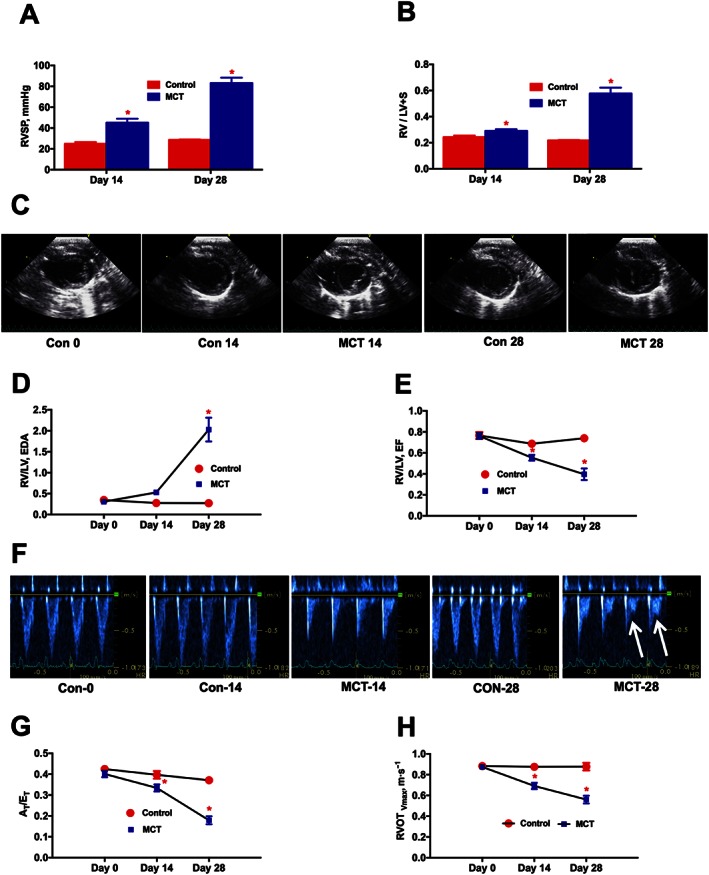
Figure 2.

Time course analysis of PH‐induced dysregulation of ventricular and pulmonary vascular remodelling. At 0, 14 and 28 days following the MCT‐insult, animals were monitored for haemodynamic and cardiac parameters. (A), and (B) represent the kinetic profile of RVSP and RVH, respectively, in controls and MCT‐challenged rats. RVH is the ratio of RV to LV + S weights, [RV/(LV + S)]. (C) Parasternal short axis view of the ventricles for control and MCT animals on Day‐0, Day‐14 and Day‐28, demonstrating a shift in the IV septum. (D) Kinetic profile of RV/LV EDA in controls and MCT‐challenged rats. RV/LV EDA is the ratio of RV versus LV EDA. (E) Kinetic profile of RV/LV EF in controls and MCT‐challenged rats. RV/LV EF is the ratio of RV EF versus LV EF and EF is the ejection fraction. (F) Image of pulsed Doppler recordings. Mid‐systolic notch is observed in the MCT animals, as indicated by the white arrows. (G) and (H) represent the kinetic profile of AT/ET and RVOTVmax in the advancement of PH. AT/ET is the ratio of acceleration time (AT) versus ejection time (ET). RVOTVmax is the velocity of pulmonary blood flow in the RVOT. Data presented in (A), (B), (D), (E), (G) and (H) are mean ± SEM (n = 6). * P value of ≤ 0.05 when comparing MCT treatment against controls.
