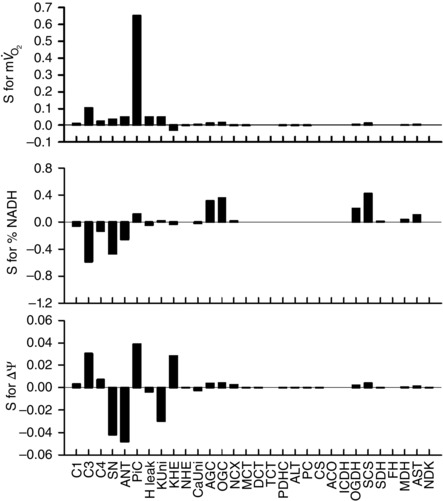
Figure 3. Sensitivity analysis of the isolated mitochondrial model .

The simulation conditions were the same as those of Fig. 2 A, with [Ca2+]cyt = 1.0 μm. Sensitivity (S) for parameter X (X = , NADH and ΔΨ) was calculated as the relative change by ±5% change of the expression level of each component: .
