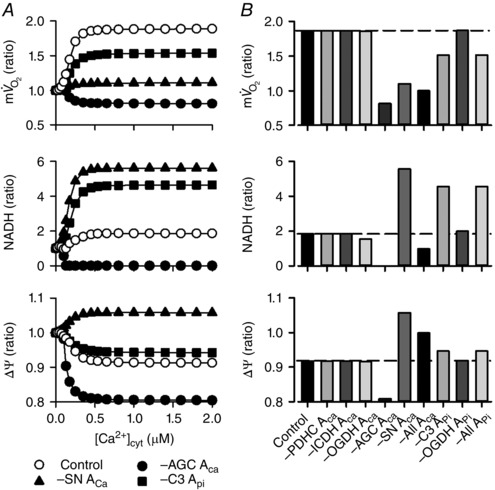
Figure 4. Contribution of the Ca2+‐ and Pi‐dependent activation mechanisms to the [Ca2+]cyt dependences in the isolated mitochondrial model .

The basic simulation condition was the same as that of Fig. 2 A. The Ca2+‐dependent activation terms of PDHC, ICDH, OGDH, AGC and SN, that is, PDHC ACa, ICDH ACa, OGDH ACa, AGC ACa and SN ACa, were removed from the mathematical formula individually or at the same time. In addition, the Pi‐dependent activation terms of Complex III and OGDH, that is, C3 APi and OGDH APi, were removed individually or at the same time. A, removal of AGC ACa, SN ACa and C3 APi. Open circles represent the control model, and filled symbols represent the absence of AGC ACa, SN ACa and C3 APi. B, summary of the simulation results. Ratios of , NADH and ΔΨ at 10–6 μm [Ca2+]cyt to those at 0.535 μm [Ca2+]cyt were plotted. Dotted lines indicate the ratios obtained from the control model. –All ACa: Ca2+‐dependent activation terms were removed from all components; –All APi: Pi‐dependent activation terms were removed from all components.
