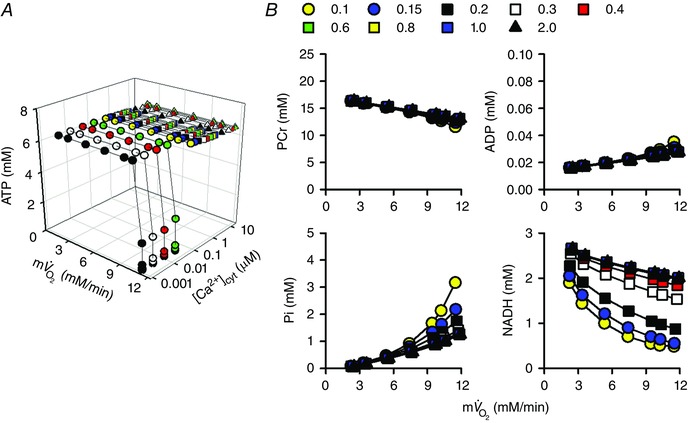
Figure 6. Workload and [Ca2+]cyt dependences of energy metabolites in the simple cardiac cell model .

The coefficient of ATP usage, k ATPuse, was changed from 1.5 × 10⁻⁵ to 1.88 × 10⁻⁴ mm ms−1, and [Ca2+]cyt was changed from 0.001 to 10 μm. A, total cytoplasmic ATP. B, cytoplasmic PCr, ADP and Pi, and mitochondrial NADH. Data at 0.1 to 2.0 μm [Ca2+]cyt are shown.
