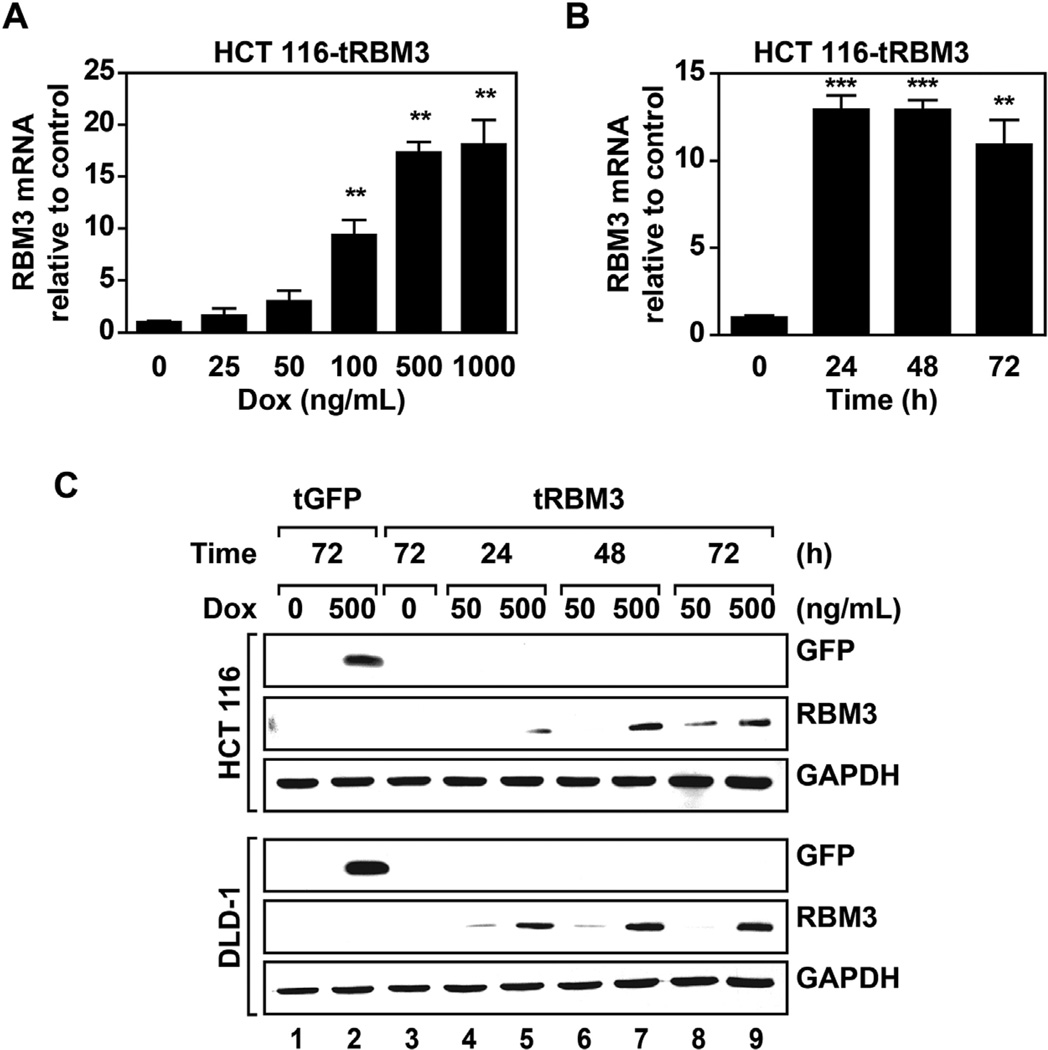
Figure 1.
RBM3 overexpression in colorectal cancer cells. (A) Real time PCR analysis of RBM3 mRNA in HCT 116 cells following 72 h induction with indicated concentrations of doxycycline. mRNA fold change is normalized to uninduced control. (B) Real time PCR analysis of RBM3 mRNA following 500 ng/mL Dox induction with indicated durations of induction. mRNA fold change is normalized to uninduced control. Graphs show mean fold change with SEM. (C) Western blot analysis of RBM3 or GFP overexpression in DLD-1 and HCT 116 inducible GFP or RBM3 cells with indicated concentrations of and times of Dox induction. Data shows significant dose- and time-dependent induction of RBM3 in the two cell lines. Graphs show mean fold change with SEM. *P < 0.05, **P < 0.01, ***P <0.001 (Student's t-test).

