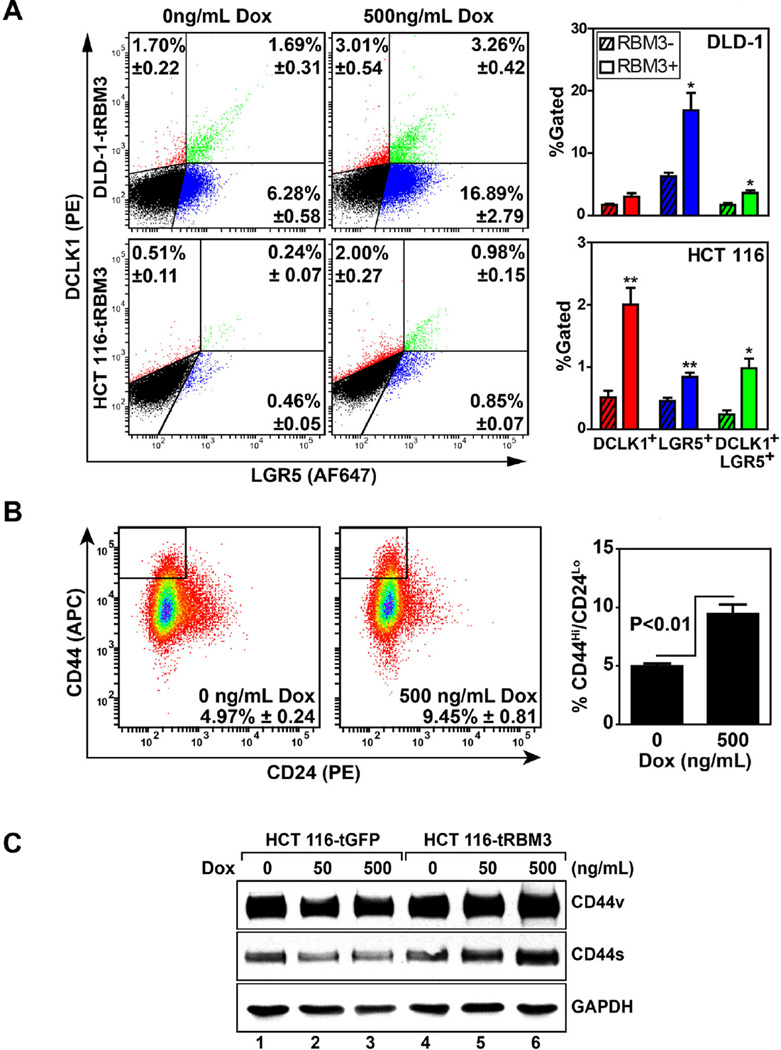
Figure 5.
Increased stem cell marker expression in HCT 116 and DLD-1 cells overexpressing RBM3. (A) Representative flow cytometry dot plot of HCT 116 and DLD-1 cells stained for DCLK1 (phycoerythrin-PE) and LGR5 (AlexaFluor 647-AF647). Bar graphs on right represent percentage of DCLK1+, LGR5+, and DCLK1+/LGR5+ double positive populations. Error bars represent SEM. P values shown are obtained with Student's t-test. *P < 0.05, **P < 0.01, ***P < 0.001 (Student's t-test). (B) Representative flow cytometry dot plot of HCT 116 cells stained for CD44 (allophycocyanin-APC) and CD24 (PE). Bar graphs on right represent percentage of CD44hi/CD24lo population of cells. Error bars represent SEM. (C) Western blot analyses for the two variants of CD44 of extracts from HCT 116 cells expressing GFP or RBM3 after induction with increasing doses (0–500 ng/mL) of doxorubicin. Data shows increased expression of both isoforms of CD44 following RBM3 overexpression.

