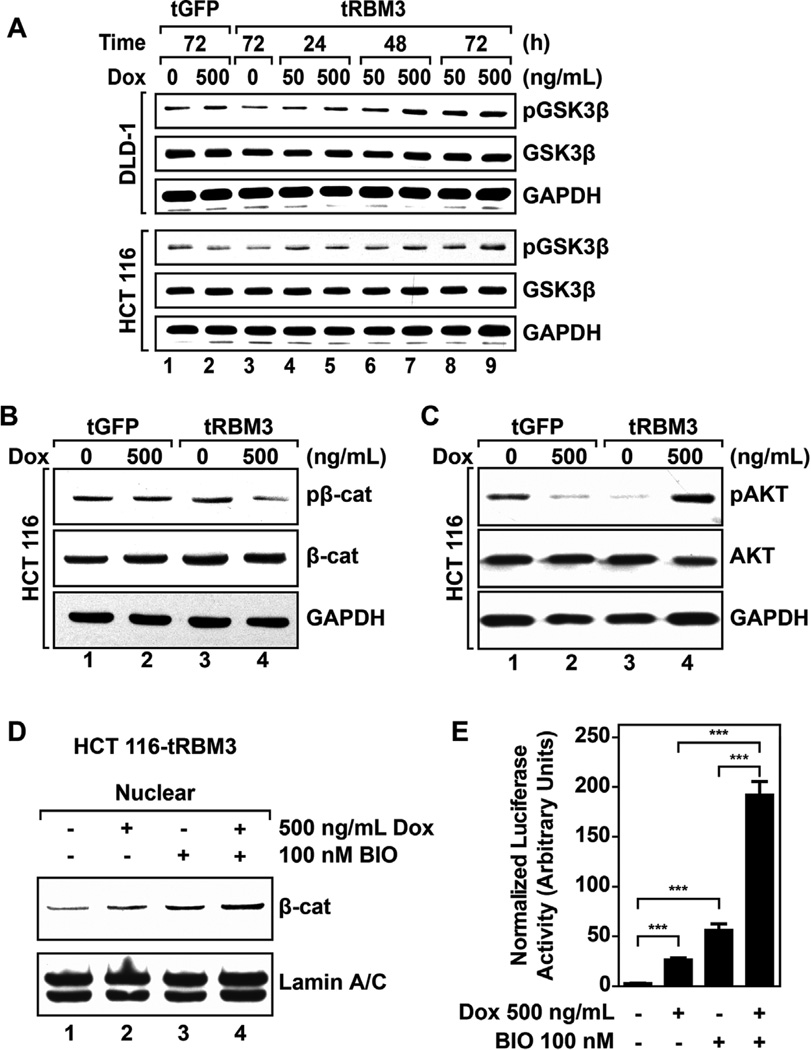
Figure 8.
Cells overexpressing RBM3 show attenuated GSK3β activity. (A) Western blots for Ser9 phosphorylation in GSK3β in DLD-1 and HCT 116 GFP or RBM3 inducible cells treated with Dox for 72 h Data shows higher levels of Ser9 phosphorylation in RBM3 overexpressing cells in both cell lines. (B) Western blots for β-catenin at Ser33/37 and Thr41 in HCT 116 GFP or RBM3 inducible cells following 72 h treatment with indicated concentration of Dox followed by 6 h of treatment with 5 µM MG132. Data shows reduced phosphorylation of β-catenin following RBM3 induction. (C) Western blots for phosphorylation of Akt at Ser473 in HCT116 GFP or RBM3 inducible cells following 72 h treatment with indicated Dox. Data shows increased phosphorylation of Akt in RBM3 overexpressing cells, while a decreased phosphorylation is observed in GFP overexpressing cells. (D) Western blot of nuclear extracts of HCT 116 RBM3 inducible cells following treatment with indicated concentrations of Dox and BIO for 72 h. Data shows increased β-catenin levels in the nucleus of following RBM3 induction, which was further increased in the presence of BIO. (E) TOPFlash luciferase assay of DLD-1 and HCT 116 RBM3 inducible cells. Cells were treated with indicated concentrations of Dox or BIO for 48 h following transfection with TOPFlash and CMV renilla luciferase plasmid. Bar graphs represent mean values of TOPFlash firefly luciferase luminescence normalized to CMV renilla luciferase luminescence. Data shows increased TOPFlash luciferase activity in the presence of RBM3 and BIO. Bar graphs show SEM. P values obtained from Student's t-test.

