
Figure 2. Kaplan-Meier survival curves for the cardiovascular mortality.
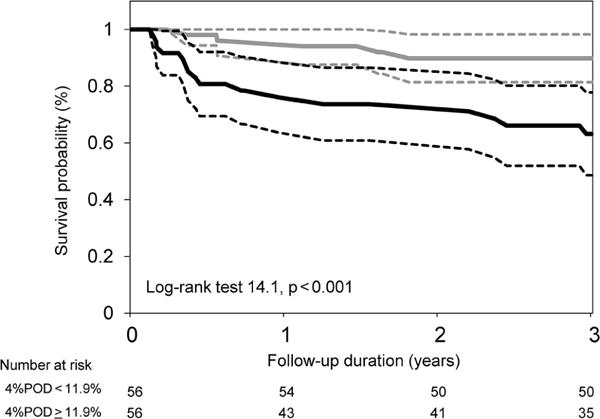
The patients were dichotomized by a median value of the 4%POD of 11.9%. The dotted lines indicate the 95% confidence interval. POD: percentage of oxygen desaturation events.
Official websites use .gov
A
.gov website belongs to an official
government organization in the United States.
Secure .gov websites use HTTPS
A lock (
) or https:// means you've safely
connected to the .gov website. Share sensitive
information only on official, secure websites.
The patients were dichotomized by a median value of the 4%POD of 11.9%. The dotted lines indicate the 95% confidence interval. POD: percentage of oxygen desaturation events.