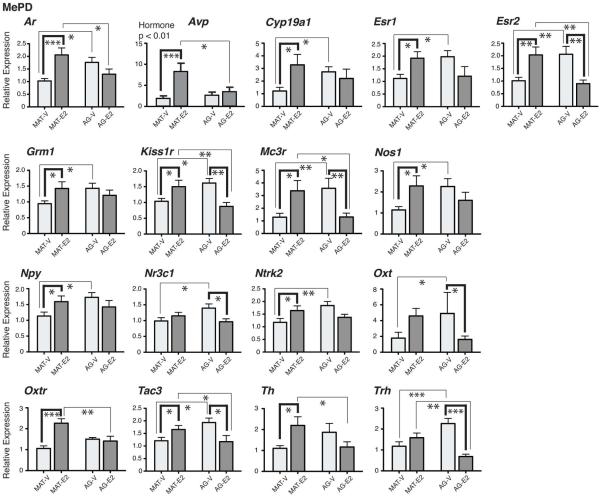
Figure 4.
Genes with significant interactions between age and hormone treatment are shown for the MePD. Significant effects of hormone within an age group are indicated by bold brackets. Significant effects of age within a hormone group are indicated by thin brackets. For Avp, there was also a significant main effect of hormone, higher in E2 than vehicle males. P-values for post-hoc analyses of the interaction effects are indicated as: *, p < 0.05; **, p < 0.01; ***, p < 0.001. Data are shown as mean + SEM.

