Table 2. Comparison of outcome variables between the reverse distraction and Kaltenborn groups using the independent t-test/Mann-Whitney U test.
| Variables | Reverse distraction mean ± SD/median |
Kaltenborn mean ± SD/median |
|---|---|---|
| VAS (cm)t * | 2.5 ± 0.9a | 5.5 ± 1.3a |
| Abduction AROM (o)t * | 165.7 ± 8.4a | 139.4 ± 13.5a |
| Abduction PROM (o)t * | 171.9 ± 7.7a | 146.4 ± 12.6a |
| E.R. AROM (o)t | 54.5 ± 13.0a | 49.4 ± 12.2a |
| E.R. PROM (o)t | 60.0 ± 11.3a | 57.6 ± 11.7a |
| HBB (%)u | 12.9b | 10.9b |
| FLEX-SF scoret | 53.1 ± 3.5a | 50.0 ± 3.3a |
VAS: visual analogue scale; AROM: active range of motion; (o): degrees;
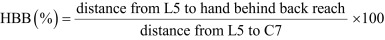
PROM: passive range of motion; ER: external rotation; HBB: hand behind back reach;
FLEX-SF: flexillevel scale of shoulder function; amean ±
SD;bmedian; tIndependent t-test;
uMann-Whitney U test; *significant at <0.05. HBB (%) was calculated
using the following formula: