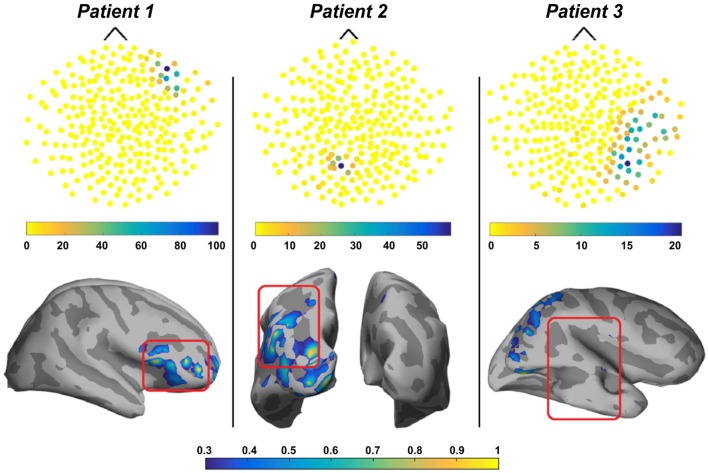
Figure 8.
Output of the detection and localization of high-frequency oscillations (HFOs) with magnetoencephalography (MEG) in three patients with focal epilepsy. Upper panels: topographic maps of the HFO detection in the MEG sensors. Each sensor is represented by a dot whose color reflects the number of detected HFOs at the time of the HFOs in the highest rate channel. Lower panels: source localization (wavelet maximum entropy on the mean) of HFOs in the ripple band for the same three patients. Sources are displayed in a normalized color scale. The epileptogenic zone, determined based on the available clinical information, is delineated with a red square. For patient 1 and 2, the sources of HFOs were totally or partially concordant with the epileptogenic region, whereas for patient 3, they were discordant. Source: adapted from von Ellenrieder et al. (50).

