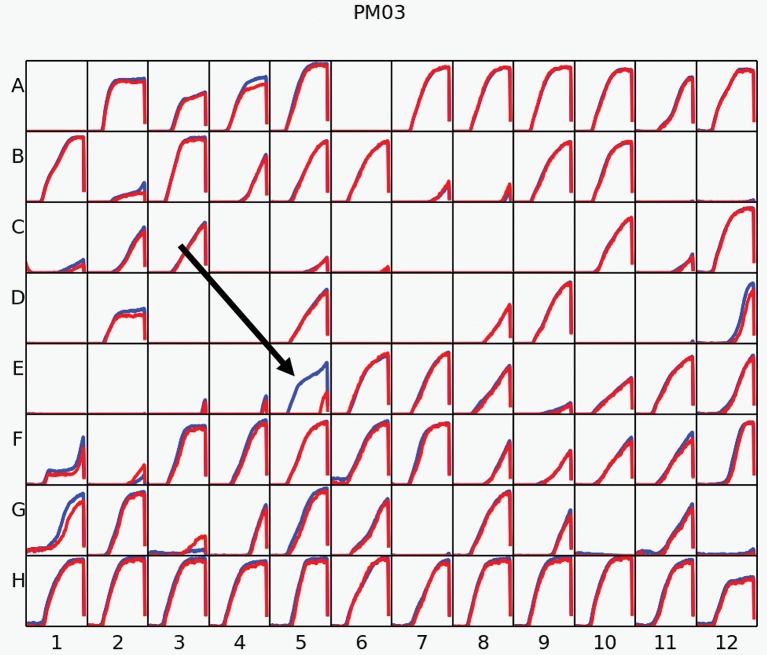
Figure 4.
Phenotype Microarray (PM). The results of PM analysis for nitrogen sources on Biolog Plate 3 in Rm1021 overexpressing acdS from AK83 strain compared to the parental one is reported. Measures were taken incubating strains with IPTG for inducing acdS gene expression. The red kinetic curves represent the strain 1021, while the blue one report the metabolic activity of 1021 pSRK acdS AK83. The black arrow underline the results obtained for the activity of the strains in presence of formamide.

