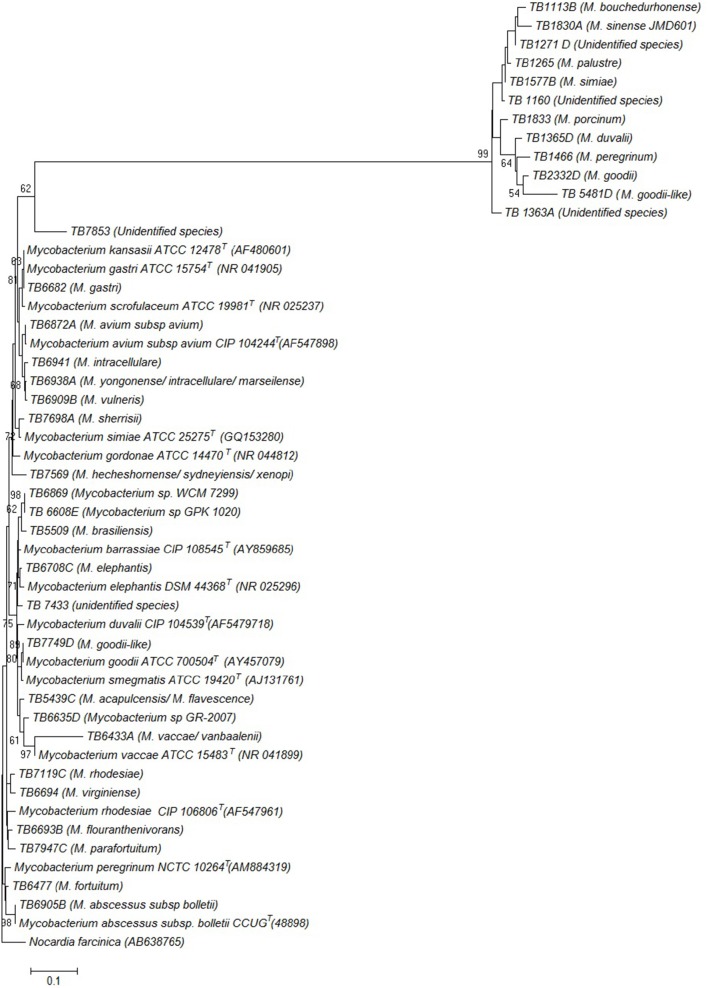
Figure 2.
Phylogenetic tree constructed using neighbor joining method, illustrating the genetic position of the isolates. The species that the isolates were found to belong to are shown in parenthesis next to each isolate. Genbank accession numbers for the reference sequences are also shown in parenthesis. The tree is based on the partial 16S rDNA gene sequences. The percentage of replicate trees in which the associated taxa clustered together in the bootstrap test (1000 replicates) are shown next to the branches. Nocardia farcinica was used as an out group sequence. Evolutionary analyses were conducted in MEGA7.

